Multiple Choice
Refer to the graph shown. 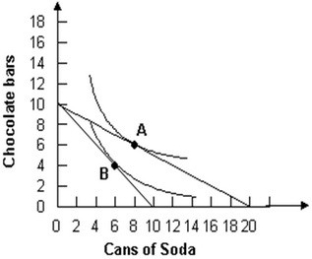 The diagram demonstrates that an increase in the price of soda will:
A) raise the quantity demanded of soda.
B) reduce the quantity demanded of soda.
C) raise the quantity demanded of chocolate bars.
D) raise the consumer's available income.
Correct Answer:

Verified
Correct Answer:
Verified
Q1: Diminishing marginal utility implies that as an
Q3: When people play the "ultimatum game," in
Q4: Refer to the graph shown. Total utility
Q5: Using indifference curve analysis, you can identify
Q6: The following table describes utility for
Q7: As a consumer moves along a budget
Q8: Tom is maximizing utility by buying three
Q9: Some kids wait until the school year
Q10: Using the indifference curve model, a demand
Q11: Behavioral economists have found that people are