Multiple Choice
Refer to the graph shown. 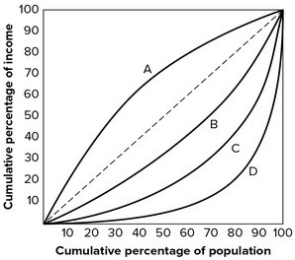 The Lorenz curve showing the most income inequality is
A) A.
B) B.
C) C.
D) D.
Correct Answer:

Verified
Correct Answer:
Verified
Related Questions
Q59: Refer to the graph shown. <img src="https://d2lvgg3v3hfg70.cloudfront.net/TB7145/.jpg"
Q60: Share distribution of income is the relative
Q61: In the United States:<br>A) the upper class
Q62: Refer to the graph shown. <img src="https://d2lvgg3v3hfg70.cloudfront.net/TB7145/.jpg"
Q63: Which of the following statements is a
Q65: Because income differs so much by type
Q66: Our ability to manage Social Security as
Q67: Our ability to manage Social Security as
Q68: A curve that shows the wealth distribution
Q69: Today, the Gini coefficient of income inequality