Multiple Choice
Refer to the graph shown. 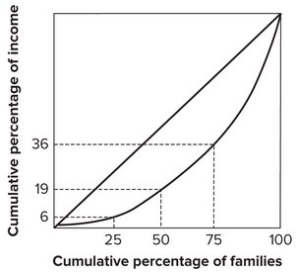 The poorest 50 percent of the families earn:
A) 6 percent of the income.
B) 19 percent of the income.
C) 36 percent of the income.
D) 64 percent of the income.
Correct Answer:

Verified
Correct Answer:
Verified
Related Questions
Q2: The official poverty income threshold in the
Q3: Over 17 million American households had a
Q4: For the purpose of determining whether a
Q5: The Lorenz curve:<br>A) is an absolute measure
Q6: John Rawls's views on income distribution and
Q8: The U.S. official poverty threshold is:<br>A) three
Q9: Which program has been very successful in
Q10: U.S. poverty figures do not include in-kind
Q11: Some economists believe that:<br>A) giving benefits to
Q12: A Lorenz curve is a geometric representation