Multiple Choice
The graph shows that: 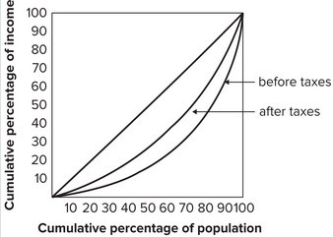
A) the effect of taxes is to make the distribution of income less equal.
B) the effect of taxes is to make the distribution of income more equal.
C) before-tax income and after-tax income are both equally distributed.
D) taxes are highly regressive.
Correct Answer:

Verified
Correct Answer:
Verified
Q90: Refer to the graph shown. <img src="https://d2lvgg3v3hfg70.cloudfront.net/TB7145/.jpg"
Q91: Refer to the graph shown. <img src="https://d2lvgg3v3hfg70.cloudfront.net/TB7145/.jpg"
Q92: Since the minimum food budget used to
Q93: For U.S. workers in tradable sectors such
Q94: According to official statistics in the United
Q95: Refer to the graph shown. <img src="https://d2lvgg3v3hfg70.cloudfront.net/TB7145/.jpg"
Q96: Other things equal, tax cuts favoring the
Q97: An example of share distribution of income
Q99: Which of the following is not one
Q100: The underclass in the United States has