Multiple Choice
Refer to the graph shown. 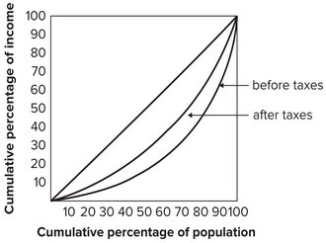 A possible explanation for the difference between the distribution of income before taxes and the distribution of income after taxes shown in the graph is that the tax system:
A) is regressive.
B) is proportional.
C) is progressive.
D) does not affect income inequality.
Correct Answer:

Verified
Correct Answer:
Verified
Q34: When a tax is progressive, the average
Q35: The program that redistributes the most money
Q36: The Lorenz curve would be a diagonal
Q37: A higher tax rate could result in
Q38: On its horizontal axis, a Lorenz curve
Q40: One study of the distribution of wealth
Q41: Real income will fall whenever:<br>A) prices and
Q42: Which of the following statements contradicts the
Q43: In most developed countries, the class system:<br>A)
Q44: Because the poor tend to use public