menu-iconExamlexExamLexServices

Discover

Ask a Question
  1. All Topics
  2. Topic
    Business
  3. Study Set
    Microeconomics Study Set 30
  4. Exam
    Exam 12: Production and Cost Analysis II
  5. Question
    Refer to the Graph Shown
Solved

Refer to the Graph Shown

Question 95

Question 95

Multiple Choice

Refer to the graph shown. Given the long-run average cost curve, a seller must produce 18 units just to break even if the price the seller expects is roughly: Refer to the graph shown. Given the long-run average cost curve, a seller must produce 18 units just to break even if the price the seller expects is roughly:   A)  $50. B)  $52. C)  $54. D)  $58.
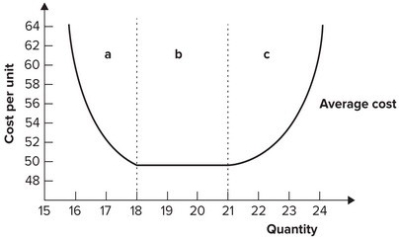

A) $50.
B) $52.
C) $54.
D) $58.

Correct Answer:

verifed

Verified

Unlock this answer now
Get Access to more Verified Answers free of charge

Related Questions

Q90: An economically efficient method of production produces

Q91: Refer to the graph shown. If the

Q92: Refer to the graph shown. The least-cost

Q93: Which of the following statements is true?<br>A)

Q94: Technological change:<br>A) reduces average total cost without

Q96: Constant returns to scale means that long-run:<br>A)

Q97: An entrepreneur is willing to bring a

Q98: Suppose a firm finds that an additional

Q99: Refer to the graph shown. If labor

Q100: The level of production that minimizes long-run

Examlex

ExamLex

About UsContact UsPerks CenterHomeschoolingTest Prep

Work With Us

Campus RepresentativeInfluencers

Links

FaqPricingChrome Extension

Download The App

Get App StoreGet Google Play

Policies

Privacy PolicyTerms of ServiceHonor CodeCommunity Guidelines

Scan To Download

qr-code

Copyright © (2025) ExamLex LLC.

Privacy PolicyTerms Of ServiceHonor CodeCommunity Guidelines