Multiple Choice
The graph shown exhibits diseconomies of scale: 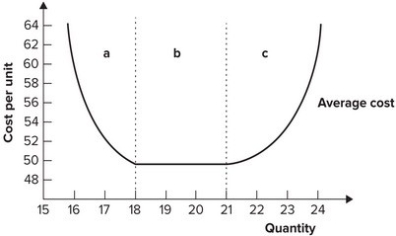
A) in region a.
B) in region b.
C) in region c.
D) over the entire range of output.
Correct Answer:

Verified
Correct Answer:
Verified
Related Questions
Q43: Refer to the graph shown. A firm
Q44: A social entrepreneur's central motivation in creating
Q45: If a firm is able to lower
Q46: At one time, sea lions were depleting
Q47: The long-run average cost curve is typically:<br>A)
Q49: The short-run average total cost curve is
Q50: Suppose a factory that produces toasters experiences
Q51: If a firm is operating at the
Q52: As you move down an isoquant:<br>A) more
Q53: Generally, as the size of a firm