Multiple Choice
The graph shown exhibits constant returns to scale: 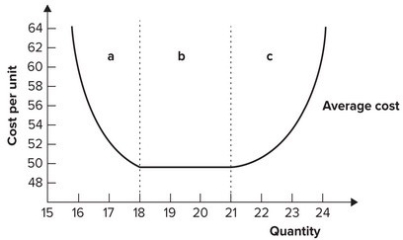
A) in region a.
B) in region b.
C) in region c.
D) in regions a, b, and c.
Correct Answer:

Verified
Correct Answer:
Verified
Related Questions
Q20: Using 100 workers and 10 machines, a
Q21: When carmakers began to cut the costs
Q22: An entrepreneur is an individual who sees
Q23: If labor costs $10 per unit and
Q24: The standard long-run model assumes that:<br>A) technology
Q26: At the minimum efficient level of production:<br>A)
Q27: In the long run:<br>A) all inputs are
Q28: If the demand for flat screen television
Q29: Refer to the graph shown. The marginal
Q30: Given that there are significant economies of