Multiple Choice
Refer to the graph shown. The shift from SATC1 to SATC2 reflects: 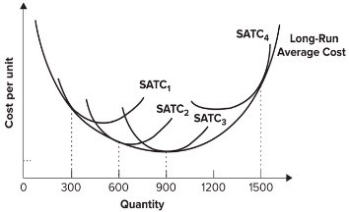
A) economies of scale.
B) diseconomies of scale.
C) diminishing marginal productivity.
D) increasing marginal productivity.
Correct Answer:

Verified
Correct Answer:
Verified
Related Questions
Q115: A firm's average cost increases as it
Q116: When per-unit costs increase as output increases,
Q117: Globalization has made economies of scope:<br>A) more
Q118: Economies of scale do not exist in
Q119: Economies of scope exist when the production
Q121: According to the text, globalization has led
Q122: Refer to the graph shown. The output
Q123: Diseconomies of scale are associated with:<br>A) an
Q124: The marginal rate of substitution of an
Q125: The upward-sloping part of the long-run average