Multiple Choice
The following graph shows average fixed costs, average variable costs, average total costs, and marginal costs of production. 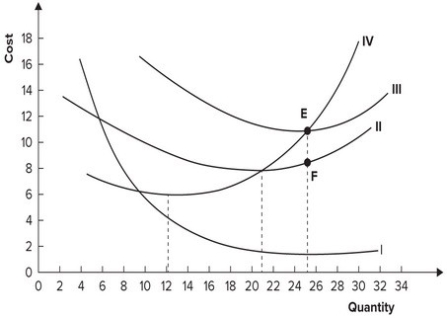 Marginal cost is minimized when output equals:
A) 6 units.
B) 12 units.
C) 21 units.
D) 25 units.
Correct Answer:

Verified
Correct Answer:
Verified
Related Questions
Q106: If the law of diminishing marginal productivity
Q107: A business produces 400 items and sells
Q108: Refer to the graph shown, which shows
Q109: A business owner makes 50 items by
Q110: When average total cost is rising, the
Q112: Which of the following cost curves is
Q113: If marginal cost is less than average
Q114: Refer to the table shown. A
Q115: When output is 50, fixed costs are
Q116: Owen runs a delivery business and currently