Multiple Choice
The following graph shows average fixed costs, average variable costs, average total costs, and marginal costs of production. 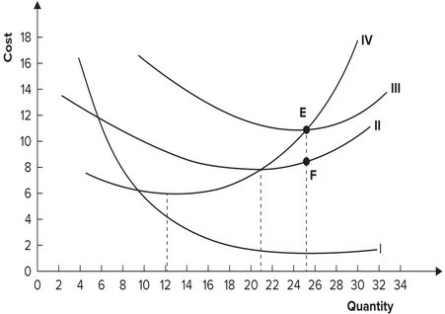 The distance EF represents:
A) average variable cost.
B) average total cost.
C) average fixed cost.
D) marginal cost.
Correct Answer:

Verified
Correct Answer:
Verified
Related Questions
Q72: Rachel left her job as a graphic
Q73: As output increases, average total cost always
Q74: When the average variable cost curve is
Q75: The only variable input used in producing
Q76: If marginal cost is greater than average
Q78: Economic profit is:<br>A) total revenue minus explicit
Q79: If a firm's average fixed cost is
Q80: If the average cost of producing 10
Q81: Other things being equal, when average productivity
Q82: Refer to the table shown. The