Multiple Choice
Refer to the graph shown. The line segment that represents average variable costs of producing Q* is: 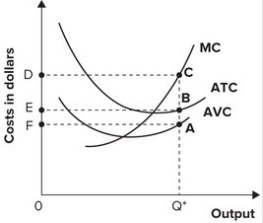
A) AQ*.
B) BQ*.
C) CQ*.
D) AB.
Correct Answer:

Verified
Correct Answer:
Verified
Related Questions
Q149: Implicit cost refers to:<br>A) the amount a
Q150: Rachel left her job as a graphic
Q151: Refer to the table shown. Marginal
Q152: A business produces eight items and sells
Q153: Refer to the graph shown. Within which
Q155: At very high levels of output, total
Q156: Refer to the table shown. If
Q157: Can accounting profit be positive while economic
Q158: Variable costs:<br>A) exist only in the short
Q159: Refer to the graph shown. Total variable