Multiple Choice
Refer to the graph shown. The line segment that represents average fixed costs of producing Q* is: 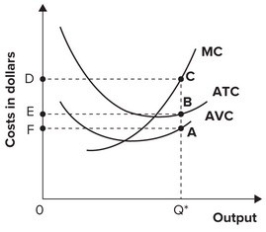
A) AC.
B) CB.
C) AB.
D) cannot be determined.
Correct Answer:

Verified
Correct Answer:
Verified
Related Questions
Q57: The average fixed cost curve is:<br>A) U-shaped.<br>B)
Q58: The difference between economic profit and accounting
Q59: Fixed costs remain the same regardless of
Q60: If marginal cost equals average total cost:<br>A)
Q61: Fixed costs plus variable costs equal:<br>A) total
Q63: If marginal cost exceeds average total cost:<br>A)
Q64: Accounting profit is equal to:<br>A) implicit revenue
Q65: The following graph shows average fixed costs,
Q66: The minimum point of the average total
Q67: Refer to the table shown. Marginal