Multiple Choice
Refer to the graph shown. Total cost of producing Q* is represented by: 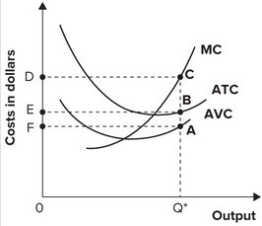
A) area 0Q*AF.
B) area 0Q*BE.
C) area 0Q*CD.
D) cannot be determined.
Correct Answer:

Verified
Correct Answer:
Verified
Related Questions
Q83: Refer to the graph shown which shows
Q84: The marginal cost curve is a mirror
Q85: Refer to the table shown. The
Q86: Refer to the table shown. A
Q87: Costs that are spent and cannot be
Q89: Refer to the table shown. When
Q90: Refer to the table shown. The
Q91: If the average cost of producing 10
Q92: If output changes by 10 units while
Q93: The marginal cost curve intersects the average