Multiple Choice
Refer to the graph shown. Total fixed cost of producing Q* is represented by: 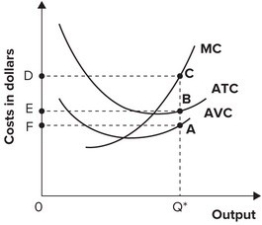
A) area 0Q*AF.
B) area ABEF.
C) area ACDF.
D) cannot be determined.
Correct Answer:

Verified
Correct Answer:
Verified
Related Questions
Q113: If marginal cost is less than average
Q114: Refer to the table shown. A
Q115: When output is 50, fixed costs are
Q116: Owen runs a delivery business and currently
Q117: Implicit and explicit revenues minus implicit and
Q119: Rachel left her job as a graphic
Q120: Refer to the table shown. If
Q121: Refer to the graph shown. This set
Q122: In the short run, average variable cost
Q123: In the short run:<br>A) some inputs are