Multiple Choice
Refer to the graph shown. 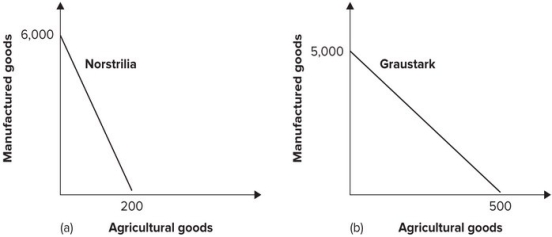 We can conclude from the diagram that:
A) Graustark has a comparative advantage in both goods.
B) Norstrilia has a comparative advantage in both goods.
C) Norstrilia has a comparative advantage in manufacturing and Graustark has a comparative advantage in agriculture.
D) Norstrilia has a comparative advantage in agriculture and Graustark has a comparative advantage in manufacturing.
Correct Answer:

Verified
Correct Answer:
Verified
Q48: Economists:<br>A) are not concerned with the distributional
Q49: If the world supply curve is S<sub>W0</sub>,
Q50: The Mexican demand for American goods leads
Q51: If the world supply curve is S<sub>W1</sub>,
Q52: How are goods manufactured in other countries
Q54: At one time, most of the cars
Q55: We can conclude from the table shown
Q56: Immediately after World War II, the United
Q57: The price of an acre of land
Q58: Refer to the graph shown. <img src="https://d2lvgg3v3hfg70.cloudfront.net/TB7145/.jpg"