Multiple Choice
Refer to the graph shown. Calculate the approximate average elasticity of demand as the price falls from $18 to $0: 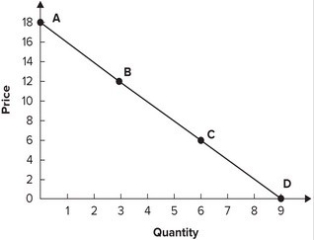
A) 3.
B) 1.
C) 2/3.
D) 3/2.
Correct Answer:

Verified
Correct Answer:
Verified
Related Questions
Q45: The cross-price elasticity of demand is the
Q46: Refer to the following table to
Q47: Repeated hurricanes in Florida have caused some
Q48: If the price of corn goes up
Q49: If the percentage increase in the quantity
Q51: A perfectly elastic supply curve would:<br>A) intersect
Q52: Refer to the graph shown. Which supply
Q53: Richard Voith estimated the price elasticity of
Q54: Along a straight-line demand curve, total revenue
Q55: If supply is highly elastic and demand