Multiple Choice
Refer to the graph shown. When price rises by 20 percent, quantity supplied rises by 25 percent. Which curve best demonstrates elasticity in this example? 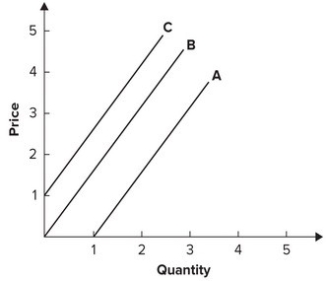
A) A
B) B
C) C
D) None of the answers is correct.
Correct Answer:

Verified
Correct Answer:
Verified
Related Questions
Q78: When the demand curve is highly inelastic,
Q79: In California, the price elasticity for vanity
Q80: Refer to the graph shown. Between points
Q81: The demand for a good is inelastic.
Q82: Refer to the table shown to
Q84: Refer to the graph shown. Which point
Q85: If demand is highly inelastic and supply
Q86: Susan's price elasticity of restaurant meals is
Q87: An economist estimates that with every 20
Q88: For complements:<br>A) cross-price elasticity of demand is