Multiple Choice
Refer to the graph shown. When price declines by 11 percent, quantity supplied falls by 8 percent. Which curve best demonstrates the elasticity in this example? 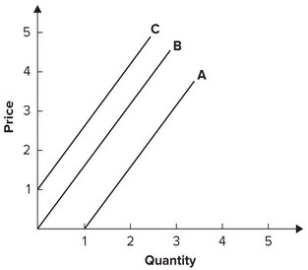
A) A
B) B
C) C
D) None of the answers is correct.
Correct Answer:

Verified
Correct Answer:
Verified
Related Questions
Q119: Refer to the graph shown. Calculate the
Q120: A supply curve that intersects the horizontal
Q121: If the price of a good goes
Q122: If average movie attendance is 250 million
Q123: Refer to the following table to
Q125: If the elasticity of demand for restaurant
Q126: If average movie ticket prices rise by
Q127: If an economist observed that higher hot
Q128: In general, the greater the elasticity, the:<br>A)
Q129: Price elasticity of demand is the:<br>A) change