Multiple Choice
Refer to the graph shown. Area F is: 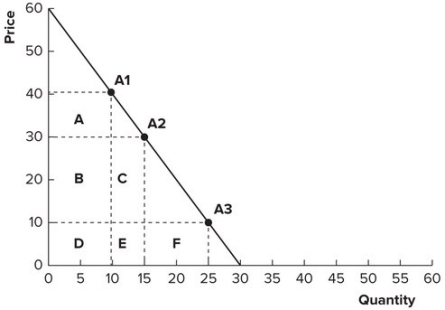
A) smaller than areas B and C, because demand is elastic between $10 and $30.
B) larger than areas B and C, because demand is elastic between $10 and $30.
C) larger than areas B and C, because demand is inelastic between $10 and $30.
D) smaller than areas B and C, because demand is inelastic between $10 and $30.
Correct Answer:

Verified
Correct Answer:
Verified
Q88: For complements:<br>A) cross-price elasticity of demand is
Q89: Refer to the graph shown. The elasticity
Q90: Refer to the graph shown. Demand is
Q91: If supply is highly inelastic and demand
Q92: Refer to the following table to
Q94: Refer to the graph shown. Calculate the
Q95: An economist estimates that for every 1
Q96: Compared to the elasticity of demand for
Q97: The demand for a good is elastic.
Q98: For normal goods, income elasticity is:<br>A) greater