Multiple Choice
Refer to the following graphs. 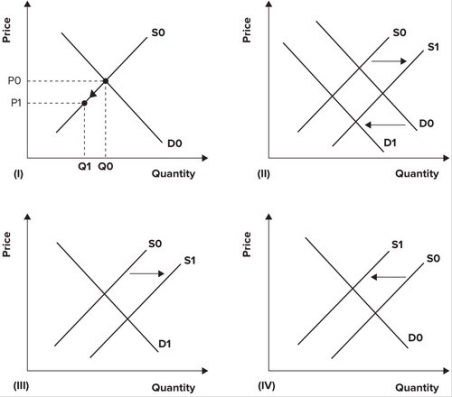 Floods in the U.S. Midwest reduce the U.S. corn crop. Which graph depicts the effect of the floods on the U.S. corn market?
A) I
B) II
C) III
D) IV
Correct Answer:

Verified
Correct Answer:
Verified
Related Questions
Q74: A decrease in quantity and price is
Q75: Season tickets to the Miami Heat games
Q76: The U.S. Postal Service printed 150,000 sheets
Q77: The standard supply/demand framework:<br>A) can be modified
Q78: Refer to the graph shown. If government
Q80: When the person who chooses how much
Q81: Suppose the price of tomatoes dramatically increases.
Q82: Suppose that initially, the equations for demand
Q83: If the government imposes an excise tax
Q84: Refer to the graph shown. If government