Multiple Choice
Refer to the following graphs. 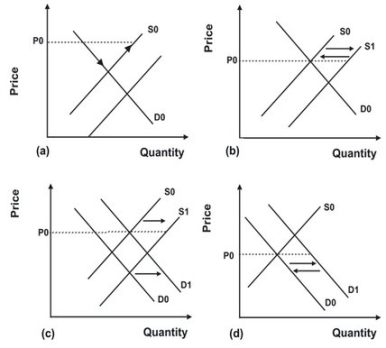 In the early 1990s, mounds of newspapers and worthless plastic piled up at recycling centers. As the nation's economy continued to grow, increased demand eliminated the mounds and turned them into shortages. In the mid-1990s, as recycling became more popular, the mounds of recycled materials returned. What graph best depicts these events on the market for recycled materials?
A) Price remained constant at P0. Quantity demanded first rose, while supply remained constant; quantity supplied then rose, while demand remained constant.
B) Price remained constant at P0. Supply first shifted from S1 to S0 and then back to S1.
C) Price remained constant at P0. Demand shifted from D0 to D1 then supply shifted from S0 to S1.
D) Price remained constant at P0. Demand shifted from D0 to D1 and then back to D0.
Correct Answer:

Verified
Correct Answer:
Verified
Q17: An increase in the Federal minimum wage,
Q18: The effect of successful compliance with recycling
Q19: When gasoline prices rose in the early
Q20: What events most likely explain the following
Q21: Refer to the graph shown that depicts
Q23: Given a downward sloping demand curve, a
Q24: Which of the following pairs of
Q25: Honus Wagner, a major league baseball player
Q26: Some years ago, Stuyvesant Town and Peter
Q27: Refer to the graph shown that depicts