Multiple Choice
Refer to the following graph. 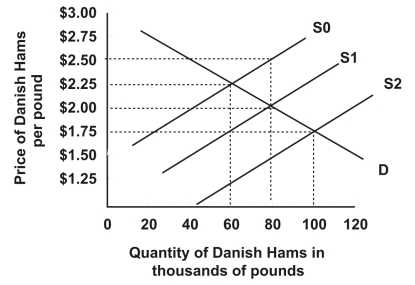 Demand and supply are initially D and S1, respectively. Which of the following best describes the effect of a $0.50 per pound tariff on Danish hams imported into the United States?
A) Supply shifts from S1 to S2; quantity sold rises to 100 thousand pounds and price paid by consumers declines to $1.75 a pound
B) Neither supply nor demand shift, but price paid by consumers declines to $1.50 a pound while quantity sold remains at 80 thousand pounds
C) Supply shifts from S1 to S0; quantity sold declines to 60 thousand pounds and price paid by consumers rises to $2.50 a pound
D) Supply shifts from S1 to S0; quantity sold declines to 60 thousand pounds and price paid by consumers rises to $2.25 a pound
Correct Answer:

Verified
Correct Answer:
Verified
Q60: Refer to the following graph. <img src="https://d2lvgg3v3hfg70.cloudfront.net/TB7145/.jpg"
Q61: The U.S. imposes substantial taxes on cigarettes
Q62: Suppose that the market labor supply and
Q63: Suppose that a consumer has a health
Q64: A Wall Street Journal headline reads: "Cigar
Q66: Quantity restrictions become more valuable to those
Q67: Refer to the graph shown. If sellers
Q68: Demand for single occupancy apartments is Qd
Q69: Rent control makes apartments:<br>A) hard to find.<br>B)
Q70: A company switches from a medical plan