Multiple Choice
Refer to the graph shown that depicts a third-party payer market for prescription drugs. What happens to expenditures by consumers in this market if a $2 co-pay is established compared to a free-market equilibrium? 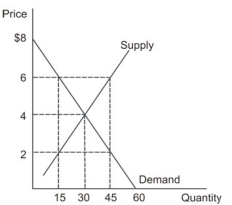
A) Expenditures fall by $30
B) Expenditures rise by $90
C) Expenditures fall by $120
D) Expenditures remain at $150
Correct Answer:

Verified
Correct Answer:
Verified
Q34: Which of the following is the best
Q35: Suppose the equilibrium price of oranges is
Q36: A price floor causes excess demand, resulting
Q37: Refer to the graph shown that depicts
Q38: Which of the following pairs of
Q40: Refer to the graph shown. A quantity
Q41: After several years of slow economic growth,
Q42: At a Chicago Bulls game 20,000 tickets
Q43: Singapore has a system of traffic regulation
Q44: If the United States imposes tariffs on