Multiple Choice
Refer to the following graph. 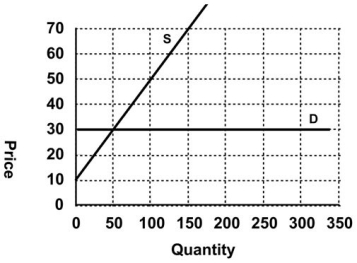 Which of the following pairs of equations describes the supply and demand curves?
A) Qs = 0.4P + 10; Qd =30 + P, respectively
B) Qs = 0.4P + 10; Qd =30, respectively
C) Qs = 2.5P − 25; P = 30 + P, respectively
D) Qs = 2.5P − 25; P = 30, respectively
Correct Answer:

Verified
Correct Answer:
Verified
Q53: When the polio vaccine first became available
Q54: Consider a market for fish whose market
Q55: Suppose that there is a renewed interest
Q56: Refer to the table shown that
Q57: A tariff is:<br>A) a tax that government
Q59: Refer to the graph shown. A quantity
Q60: Refer to the following graph. <img src="https://d2lvgg3v3hfg70.cloudfront.net/TB7145/.jpg"
Q61: The U.S. imposes substantial taxes on cigarettes
Q62: Suppose that the market labor supply and
Q63: Suppose that a consumer has a health