Multiple Choice
Use the following graph for the question. 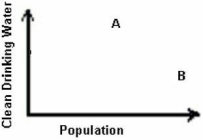
-On the graph of clean drinking water per person,each letter represents a country.Which of the following is most likely?
A) A is the United States;B is India.
B) A is India;B is the United States.
C) A is the United States;B is Canada.
D) A is China;B is India.
E) A is India;B is Canada.
Correct Answer:

Verified
Correct Answer:
Verified
Q2: A country's renewable water supplies are generally
Q3: _ is a point source of water
Q4: The amount of groundwater that can fill
Q5: The residence time for an average water
Q6: Plants that take up heavy metals found
Q8: What would you not find in water
Q9: Application of fertilizer to farm fields is
Q10: Which of the following is a nonpoint
Q11: In general,water use in poor countries is
Q12: The hydrologic cycle distributes water across the