Multiple Choice
Refer to the graph shown. If the supply curve shifts from S1 to S2, the value of the dollar will: 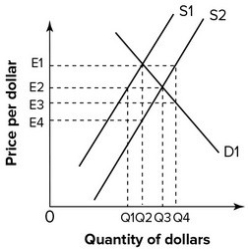
A) increase in response to excess demand equal to Q4 - Q2.
B) increase in response to excess demand equal to Q3 - Q1.
C) decrease in response to excess supply equal to Q4 - Q2.
D) decrease in response to excess supply equal to Q3 - Q1.
Correct Answer:

Verified
Correct Answer:
Verified
Q98: If the United States wants to strengthen
Q99: Suppose a government wants to fix its
Q100: Refer to the graph shown. The purchase
Q101: What are the three pathways through which
Q102: What is the difference between a fixed,flexible,and
Q104: Expansionary monetary policy affects domestic income in
Q105: A currency support policy consists of the:<br>A)selling
Q106: Critics of purchasing power parity argue that:<br>A)it
Q107: Contractionary monetary policy generally:<br>A)lowers U.S. interest rates.<br>B)decreases
Q108: Using a supply and demand diagram for