Multiple Choice
Refer to the graph shown. The relationship represented in the figure is called a: 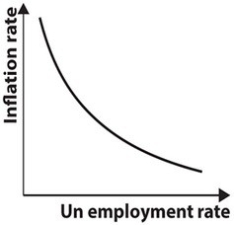
A) labor supply curve.
B) labor demand curve.
C) short-run Phillips curve.
D) long-run Phillips curve.
Correct Answer:

Verified
Correct Answer:
Verified
Related Questions
Q61: According to the text, if individuals base
Q62: Economists who believe in the quantity theory
Q63: The short-run Phillips curve differs from the
Q64: Assume the money supply is $1000,the velocity
Q65: Use a Phillips curve diagram to explain
Q67: Velocity can be calculated as the ratio
Q68: How would institutionally focused economist's explanation of
Q69: According to the quantity theory:<br>A)unemployment is everywhere
Q70: When inflation is unexpected, it tends to
Q71: According to the quantity theory of money,