Multiple Choice
Refer to the graph shown. Expectations of inflation are 2 percent at point(s) : 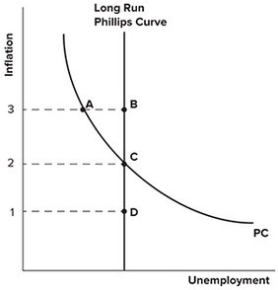
A) A and C.
B) B.
C) D.
D) B, C, and D.
Correct Answer:

Verified
Correct Answer:
Verified
Related Questions
Q139: Using the equation of exchange,describe the difference
Q140: The quantity theory of money:<br>A)is no longer
Q141: According to the text, if individuals base
Q142: Asset price inflation occurs when the prices
Q143: Explain how the quantity theory of money
Q145: Refer to the graph shown. Suppose an
Q146: In 1964 and 1970, unemployment was about
Q147: If inflation increases unexpectedly, then:<br>A)borrowers tend to
Q148: Consider the following Phillips curve diagram: <img
Q149: Non-economists often say that inflation makes the