Multiple Choice
Refer to the graph shown. If actual inflation is 12 percent and expected inflation is 6 percent, the economy will be at point: 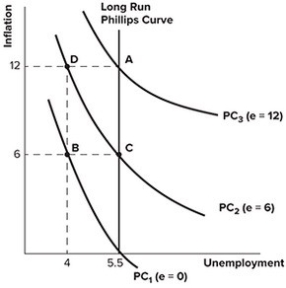
A) A.
B) B.
C) C.
D) D.
Correct Answer:

Verified
Correct Answer:
Verified
Related Questions
Q3: Generally, in the United States today, goods
Q4: Suppose the money supply is $8 trillion
Q5: If inflation is highly volatile, money is:<br>A)more
Q6: Asset price inflation can be a problem
Q7: According to the quantity theory of money,
Q9: Asset deflation generally:<br>A)is more harmful than the
Q10: Unemployment rates above the target rate of
Q11: Who wins and who loses when there
Q12: Asset inflation tends to hurt those who
Q13: According to the quantity theory of money,