Multiple Choice
Refer to the graph shown. The shift in the short-run Phillips curve shown is most likely to be caused by: 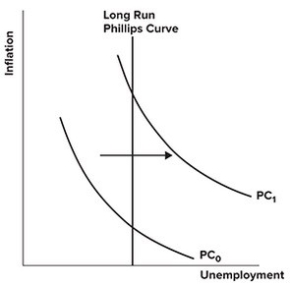
A) a decrease in expected inflation.
B) an increase in expected inflation.
C) a decrease in labor productivity.
D) an increase in labor productivity.
Correct Answer:

Verified
Correct Answer:
Verified
Q69: According to the quantity theory:<br>A)unemployment is everywhere
Q70: When inflation is unexpected, it tends to
Q71: According to the quantity theory of money,
Q72: The long-run Phillips curve shifts to the
Q73: According to institutionally-focused economists:<br>A)the direction of causation
Q75: If global prices are lower than domestic
Q76: It's difficult to measure asset inflation because
Q77: The quantity theory of money concludes that
Q78: Draw a short run and long-run Phillips
Q79: Inflation is undesirable because it:<br>A)always makes the