Multiple Choice
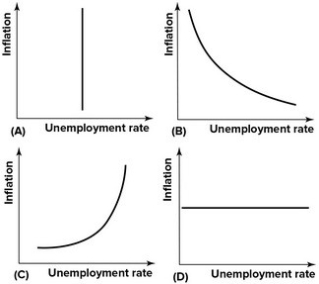
Refer to the graphs shown. Which of the graphs correctly depict the long-run Phillips curve? 
A) A
B) B
C) C
D) D
Correct Answer:

Verified
Correct Answer:
Verified
Related Questions
Q18: The higher the rate of inflation, the
Q19: As the economy moves to the right
Q20: Explain the difference between the distributional effects
Q21: When people refer to inflation,are they generally
Q22: If the velocity of money is increasing,
Q24: The institutionalist theory of inflation differs from
Q25: The Phillips curve represents a relationship between:<br>A)inflation
Q26: A cost of inflation is that it:<br>A)makes
Q27: If monetary policy makers want to target
Q28: One assumption that changes the equation of