Multiple Choice
Refer to the graph shown. Suppose the government borrows $50 million to finance an increase in its spending and that as a result, the level of investment is reduced by $50 million. In this case, the aggregate demand curve will: 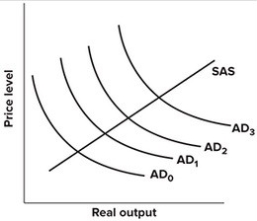
A) shift from AD0 to AD2 but then back to AD1.
B) shift from AD0 to AD2 but then out to AD3.
C) shift from AD0 to AD2.
D) not shift.
Correct Answer:

Verified
Correct Answer:
Verified
Q14: If an economy is above potential output
Q15: If private investment is relatively sensitive to
Q16: Why did proponents of sound finance oppose
Q17: Fiscal policy would be more effective if:<br>A)potential
Q18: When the economy is experiencing inflation, an
Q20: If the government knew the level of
Q21: What did the sound finance approach to
Q22: Between 1999 and 2009, the U.S. federal
Q23: Suppose the government never borrows, so that
Q24: The theoretical proposition that government deficits do