Multiple Choice
The graph below shows what happens when the Fed implements: 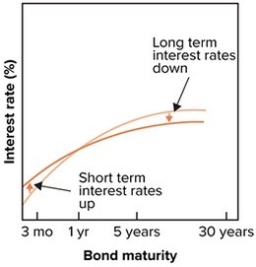
A) operation twist.
B) credit easing.
C) quantitative easing.
D) precommitment policies.
Correct Answer:

Verified
Correct Answer:
Verified
Related Questions
Q66: What is the moral hazard problem?
Q77: Briefly discuss the leveraging that took place
Q78: A general principle of regulation is:<br>A)do not
Q79: Which of the following would not address
Q80: Which of the following is not an
Q81: Quantitative easing involves all of the following
Q84: Quantitative easing refers to:<br>A)a gradual reduction in
Q85: I invest $100 in a stock and
Q86: Leveraging can encourage herding behavior.
Q87: Which of the following would have the