Multiple Choice
Refer to the graph shown. From 1938 to 1943 the Federal deficit rose from $1.0 billion to $53.8 billion due to increased defense spending. The effect of this on the AD curve can be shown by a movement from: 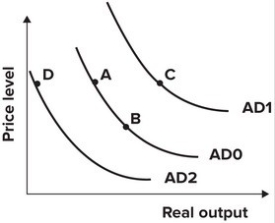
A) A to B.
B) A to C.
C) A to D.
D) B to A.
Correct Answer:

Verified
Correct Answer:
Verified
Related Questions
Q145: If total income remains the same but
Q146: Potential income is that level of income
Q147: Most economists agree that the aggregate demand
Q148: As prices fall, the value of people's
Q149: From 1975 to 1995, the value of
Q151: If productivity increases by 2 percent but
Q152: Refer to the graph shown. If the
Q153: If potential output exceeds actual output, the
Q154: The short-run aggregate supply curve is upward
Q155: Demonstrate graphically and explain verbally the role