Multiple Choice
Refer to the graph shown. During the Reagan Administration (1981 to 1989) , tax rates were reduced significantly, while federal defense spending rose by 80 percent. The effect of these policies on the AD curve is best shown as a movement from: 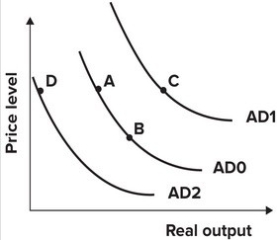
A) A to B.
B) A to C.
C) A to D.
D) B to A.
Correct Answer:

Verified
Correct Answer:
Verified
Q93: The long-run aggregate supply curve shows the
Q94: Refer to the graph shown. If the
Q95: If a country is experiencing high inflation,
Q96: Suppose that consumer spending is expected to
Q97: If the depreciation of a country's currency
Q99: If the price level falls but people
Q100: The reason why the AS/AD model does
Q101: The new government of Pakistan transfers money
Q102: Refer to the graph shown. An economy
Q103: Under what circumstances is it most clear