Multiple Choice
Refer to the graph shown. In 1930, the United States passed the Smoot-Hawley Tariff Act, which raised tariffs on imported goods at an average of 60 percent. Other countries retaliated with similar tariffs and world output declined. The effect of the decline in foreign output on the U.S. AD curve can be shown by a movement from: 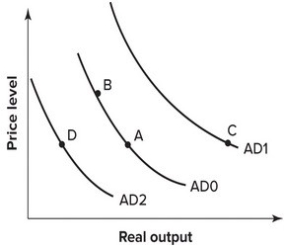
A) A to B.
B) A to C.
C) A to D.
D) B to A.
Correct Answer:

Verified
Correct Answer:
Verified
Q42: A rise in the U.S. price level
Q43: The paradox of thrift will not arise
Q44: Refer to the graph shown. In the
Q45: According to Keynes there is a difference
Q46: Explain what will happen to the SAS
Q48: To combat inflation in 1955 and 1956,
Q49: If the U.S. government increases its expenditures
Q50: A fall in a foreign country's income
Q51: A shift in the long-run aggregate supply
Q52: The paradox of thrift occurs when:<br>A)an increase