Multiple Choice
Refer to the graph shown. From 1929 to 1933 the money supply fell in the United States by 40 percent. The effect of this on the AD curve is best shown by a movement from: 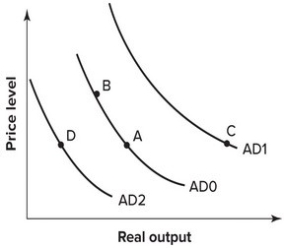
A) A to B.
B) A to C.
C) A to D.
D) B to A.
Correct Answer:

Verified
Correct Answer:
Verified
Related Questions
Q189: If the dollar appreciates while foreign income
Q190: What is the difference,in terms of the
Q191: In early 2000s, oil prices were rising
Q192: A fiscal policy in which the government
Q193: In principle, we would expect the aggregate
Q195: The axes for the short-run aggregate supply
Q196: If potential output is unknown:<br>A)we can still
Q197: Which of the following is not a
Q198: If the economy is not in a
Q199: An increase in the aggregate demand curve