Multiple Choice
Refer to the following graph. 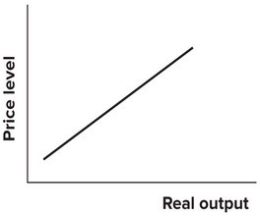 The upward sloping relationship in the diagram represents the:
A) aggregate demand curve.
B) short-run aggregate supply curve.
C) long-run aggregate supply curve.
D) quantity adjustment curve.
Correct Answer:

Verified
Correct Answer:
Verified
Q18: An expansionary fiscal policy would be countercyclical
Q19: Using an AS/AD diagram,demonstrate graphically and explain
Q20: In 2001,the U.S.economy suffered a mild recession.As
Q21: If actual output exceeds potential output, the
Q22: If potential output is less than actual
Q24: If the multiplier effect did not exist,
Q25: Expansionary policy that followed the 2008 recession:<br>A)led
Q26: The AS/AD model looks similar to the
Q27: Federal Reserve policy makers argue about whether
Q28: If the dollar were to depreciate against