Multiple Choice
Refer to the graph shown. A movement from D to B is most likely to be caused by: 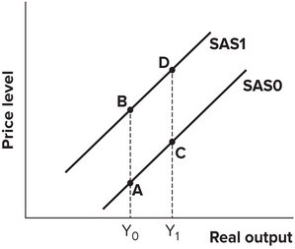
A) an increase in expected inflation.
B) a decrease in input prices.
C) a decrease in import prices.
D) a decrease in aggregate demand.
Correct Answer:

Verified
Correct Answer:
Verified
Related Questions
Q9: Some economists believe that the good times
Q10: What is the paradox of thrift?
Q11: Refer to the graph shown. An economy
Q12: Canada is the largest trading partner of
Q13: If businesses expect future demand to increase,
Q15: Refer to the graph shown. The economy
Q16: If the U.S. government increases its expenditures
Q17: Suppose the economy is in an inflationary
Q18: An expansionary fiscal policy would be countercyclical
Q19: Using an AS/AD diagram,demonstrate graphically and explain