Multiple Choice
Refer to the following graph. 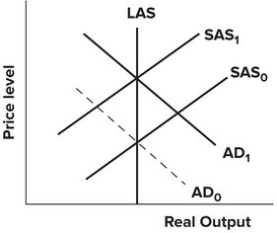 The massive increase in defense spending is best represented by the:
A) AD curve shifting from AD0 to AD1.
B) AD curve shifting from AD1 to AD0.
C) SAS curve shifting from SAS0 to SAS1.
D) SAS curve shifting from SAS1 to SAS0.
Correct Answer:

Verified
Correct Answer:
Verified
Q169: An inflationary gap exists when:<br>A)aggregate demand exceeds
Q170: Explain why the long-run aggregate supply (LAS)curve
Q171: Refer to the graph shown. A decrease
Q172: What is deflation? What could deflation do
Q173: Keynes believed that an increase in savings
Q175: An increase in production costs is most
Q176: The theoretical proposition that the price level
Q177: Refer to the graph shown. If the
Q178: If total income in Sweden remains the
Q179: A fall in the value of the