Multiple Choice
Refer to the following diagram. 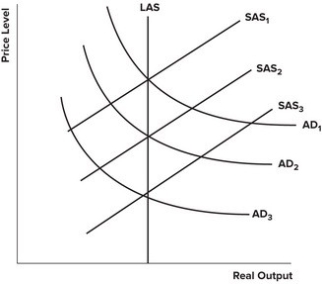 A decline in U.S. housing prices, as in 2007, pushed the AD curve from AD1 to AD2. Dynamic feedback effects that would destabilize the economy could shift:
A) SAS1 to SAS2.
B) SAS2 to SAS3.
C) AD2 to AD1.
D) AD2 to AD3.
Correct Answer:

Verified
Correct Answer:
Verified
Related Questions
Q79: Refer to the graph shown. A decrease
Q80: In the AS/AD model, the repercussion that
Q81: Assuming the economy is in long-run equilibrium,using
Q82: If the price level had more flexibility,would
Q83: Keynes believed that:<br>A)the government could not aid
Q85: Refer to the graph shown. A movement
Q86: An increase in the price level might
Q87: A fall in the U.S. price level
Q88: A decrease in the expected future income
Q89: Keynes did not agree with the way