Essay
Consider the following diagram 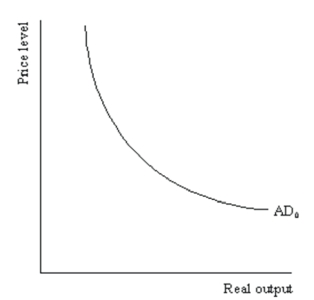 Demonstrate graphically and explain verbally the impact of a decrease of 50 in government spending on the AD curve in the diagram when the multiplier is 3.
Correct Answer:

Verified
The total impact of the decrease of 50 o...View Answer
Unlock this answer now
Get Access to more Verified Answers free of charge
Correct Answer:
Verified
View Answer
Unlock this answer now
Get Access to more Verified Answers free of charge
Q64: Refer to the graph shown. A policy
Q65: With an upward-sloping short-run aggregate supply curve,
Q66: If actual output exceeds potential output, eventually:<br>A)input
Q67: In the 1990s, the price level in
Q68: Refer to the graph shown. In the
Q70: A fall in the price level:<br>A)reduces the
Q71: An economy's resources:<br>A)can never be overutilized.<br>B)can always
Q72: Demonstrate graphically and explain verbally the comparison
Q73: In the early 1930s, U.S. government expenditures
Q74: What factors shift the short-run aggregate supply