Multiple Choice
Refer to the graph shown. Total utility is at its maximum at point: 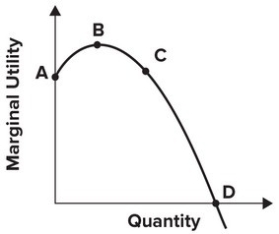
A) A.
B) B.
C) C.
D) D.
Correct Answer:

Verified
Correct Answer:
Verified
Related Questions
Q1: Suppose that every time you go to
Q14: What is the marginal rate of substitution?
Q34: Crackerjacks cost twice as much as Doritos.
Q66: Jack Sprat could eat no fat, his
Q72: If the total utility curve is a
Q98: The slope of a budget constraint with
Q110: The faster marginal utility declines the:<br>A) greater
Q117: Steve is currently maximizing utility by consuming
Q125: As a consumer moves along an indifference
Q126: Popeye cannot eat enough free spinach. With