Multiple Choice
Refer to the graph shown. Between points C and D, marginal utility is: 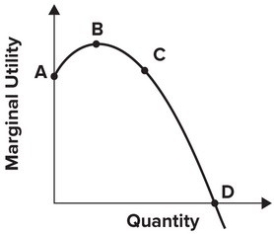
A) decreasing, and so total utility is falling.
B) positive, and so total utility is increasing.
C) positive, and so total utility is falling.
D) decreasing, and so total utility is at its maximum.
Correct Answer:

Verified
Correct Answer:
Verified
Q9: Describe how the principle of rational choice
Q17: A Big Mac meal costs $3.00 and
Q18: The status quo bias implies that:<br>A) people's
Q44: You're maximizing utility when:<br>A) (MU of X)/
Q53: A rational consumer maximizes his or her:<br>A)
Q55: Suppose that a haircut will give Dawn
Q58: Joe is maximizing utility by consuming three
Q104: According to Thorstein Veblen, a successful businessman
Q123: According to the principle of rational choice,
Q133: Refer to the following graph. <img src="https://d2lvgg3v3hfg70.cloudfront.net/TB7143/.jpg"