Multiple Choice
Refer to the graph shown. 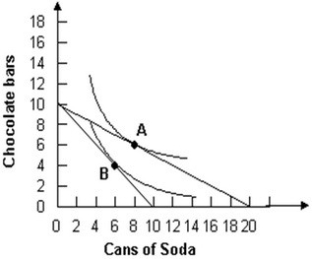 The diagram demonstrates that an increase in the price of soda will:
A) raise the quantity demanded of soda.
B) reduce the quantity demanded of soda.
C) raise the quantity demanded of chocolate bars.
D) raise the consumer's available income.
Correct Answer:

Verified
Correct Answer:
Verified
Q13: When marginal utility is positive, total utility
Q28: What is meant by "utility" and how
Q38: Jason is faced with two options: A
Q56: The absolute value of the slope of
Q60: Behavioral economics:<br>A) tests the underlying economic assumptions
Q87: As long as total utility is increasing,
Q108: Suppose Jane has chosen a combination of
Q114: Refer to the graphs shown, which show
Q115: Suppose you are considering volunteering some
Q128: Joseph Gallo poured two glasses of wine