Multiple Choice
Refer to the graph shown. 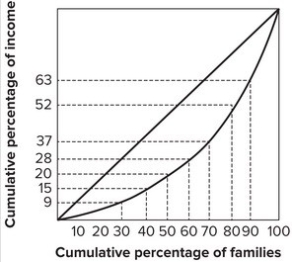 The poorest 30 percent of the families earn:
A) 2 percent of the income.
B) 5 percent of the income.
C) 9 percent of the income.
D) 15 percent of the income.
Correct Answer:

Verified
Correct Answer:
Verified
Related Questions
Q1: Some critics complain that official U.S. poverty
Q3: Describe three methods of affecting income distribution
Q4: Refer to the following graph. <img src="https://d2lvgg3v3hfg70.cloudfront.net/TB7143/.jpg"
Q11: Describe the difference between share distribution of
Q11: Some economists believe that:<br>A) giving benefits to
Q16: What is the difference between wealth and
Q17: The trend back toward greater inequality in
Q24: One study of the distribution of wealth
Q26: One way to look at inequality is
Q80: The United States has the least income