Multiple Choice
Refer to the graph shown. 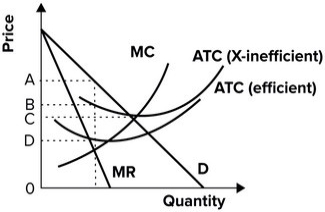 The per-unit cost incurred by a monopolist that is X-inefficient but produces the profit-maximizing level of output is best illustrated by:
A) A.
B) B.
C) C.
D) D.
Correct Answer:

Verified
Correct Answer:
Verified
Q7: Suppliers would be the most eager to
Q9: A sizeable proportion of corporate takeovers are
Q11: Explain how owners can try to deal
Q14: Competition is best seen as a process.
Q18: Define X-inefficiency and explain how the threat
Q26: A firm will spend money on a
Q54: Real-world market structures tend to be:<br>A) perfectly
Q76: Refer to the graph shown. <img src="https://d2lvgg3v3hfg70.cloudfront.net/TB7143/.jpg"
Q78: Refer to the graph shown. <img src="https://d2lvgg3v3hfg70.cloudfront.net/TB7143/.jpg"
Q78: According to Peter Theil's book Zero to