Multiple Choice
The following graph shows average fixed costs, average variable costs, average total costs, and marginal costs of production. 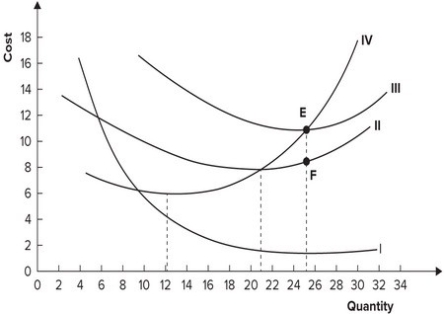 The distance EF represents:
A) average variable cost.
B) average total cost.
C) average fixed cost.
D) marginal cost.
Correct Answer:

Verified
Correct Answer:
Verified
Q23: Accounting profit and economic profit differ because
Q23: Why do most firms operate at output
Q29: What is the distinction between the microeconomic
Q72: Rachel left her job as a graphic
Q125: Fixed costs exist only in the:<br>A) long
Q127: The vertical distance between the average total
Q133: The average total cost of producing electronic
Q158: Refer to the graph shown. <img src="https://d2lvgg3v3hfg70.cloudfront.net/TB7143/.jpg"
Q158: Variable costs:<br>A) exist only in the short
Q165: Refer to the table shown. If