Multiple Choice
Refer to the following graph. 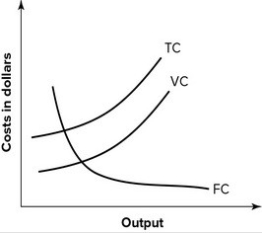 This set of cost curves is:
A) correct.
B) wrong because the total cost and variable cost curves are reversed.
C) wrong because the fixed cost curve is drawn incorrectly.
D) wrong because the total cost and variable cost curves are actually the average total cost and average variable cost curves.
Correct Answer:

Verified
Correct Answer:
Verified
Q11: You are given that the total cost
Q15: If your latest test grade and your
Q34: In the short run:<br>A) all inputs are
Q36: In the long run all inputs are
Q107: A business produces 400 items and sells
Q139: The following graph shows average fixed costs,
Q140: Refer to the graph shown. Within which
Q145: Refer to the table shown. The
Q147: To make sure that you understand
Q148: Refer to the table shown. The